The synergy between Real Estate and Geographic Information Systems (GIS) has transformed from a luxury for high-end developers into an essential toolkit for anyone navigating the property market. In a city like Chicago, where a single block can represent a massive shift in property value, school quality, and transit accessibility, GIS is the bridge between raw data and informed decision-making.

The Strategic Link: Why Real Estate Needs GIS
Real estate is inherently spatial. While a spreadsheet can tell you a property’s price and square footage, GIS tells you its context. In Chicago’s dense urban fabric, context is everything. GIS integrates layers of information—zoning laws, flood risks, tax increments (TIF districts), and neighborhood demographics—into a single visual interface.
By 2026, Chicago’s market has stabilized after the volatility of the early 20s, with median prices around $365,000. In this “managed pace” market, GIS allows buyers and investors to conduct deep due diligence that was previously impossible.
The Power of the Radius: Beyond the “Search Bar”
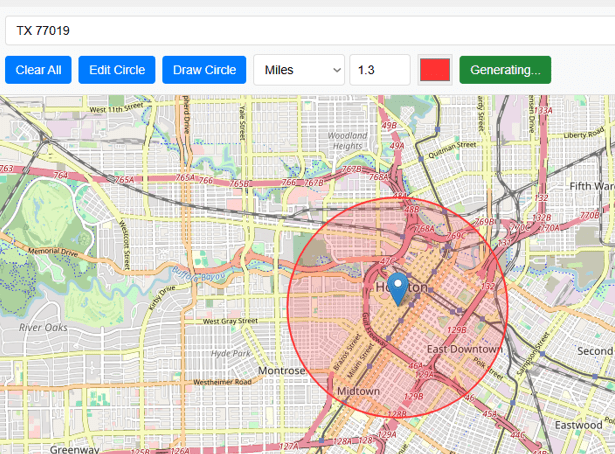
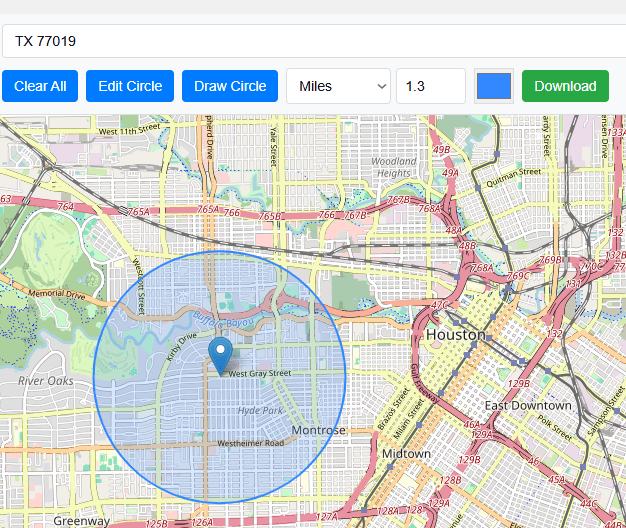
One of the most powerful features of a GIS-enabled real estate tool is the Radius draw. Drawing a circle on a map does more than just filter results; it creates a “spatial buffer” that answers critical lifestyle and financial questions.
1. The “15-Minute City” Analysis
Chicagoans increasingly prioritize walkability. By drawing a 0.5-mile radius around a listing in neighborhoods like the West Loop or Logan Square, a user can instantly visualize:
- • Grocery Access: Are there high-end options like Whole Foods or local markets within that circle?
- • Transit Proximity: Does the radius intersect with a “L” station or a major bus artery?
- • Green Space: How many parks or public plazas fall within the buffer?
2. School District and Catchment Precision
Standard zip code searches are often misleading because school boundaries don’t follow zip codes. A radius tool allows a parent to draw a perimeter around a specific school to find every available home within walking distance, ensuring they stay within the desired enrollment zone.
3. Investment Gap Analysis
For developers, drawing multiple radii (e.g., 1-mile, 3-miles, 5-miles) helps identify “service deserts.” If a developer draws a 1-mile radius around a potential site in Bronzeville and notices zero pharmacies or coffee shops, they have identified a high-value commercial opportunity that a traditional list-based search would have missed.
Chicago Case Study: The “L” Train Effect
In Chicago, property values often follow the path of the CTA. Using GIS, users can perform a Linear Buffer Analysis. Instead of a circle, they “trace” a radius along a train line.
In 2026, as buyers look for value in areas like Avondale or Albany Park, they use GIS to find properties within a 10-minute walk of the Blue or Brown lines. This “walk-time” radius is more accurate because it accounts for physical barriers like the Chicago River or highway overpasses.
Future Trends: 3D GIS and Digital Twins
Chicago is leading the way in Digital Twins—3D GIS models of the entire city. For a real estate buyer in 2026, this means:
- • Shadow Analysis: Drawing a radius to see if a proposed high-rise nearby will block the sunlight to their garden.
- • View Visualization: Virtually “standing” on a 20th-floor balcony of a new South Loop development to see exactly what the skyline view will look like before the building is even finished.